How photo evidence at handoff cuts claim disputes by 64%
A worked teardown of three months of handoff photos at a modeled 28-van fleet — and the claims math behind it.
Picture a DSP in Bremen — 28 vans, two routes, three years on the Amazon network — that rolls out structured handoff photos through Fleet by Elevera in late January and wants to see what the numbers say by Q1 close.
This post is the teardown of that scenario. The fleet is an illustrative composite — sized and sequenced from published claims-management data and the dispute mechanics we built Fleet around, not a named customer's audited books. The mechanism it walks through is exactly how structured photo evidence changes a claims conversation; the magnitudes are the model's, yours will differ.
The problem they walked in with
Their P&L for 2025 had €31,400 in net claim losses — damage they paid for that they believed wasn't theirs. Most of it came from the same place: a vehicle would come back at end-of-shift with a dent or scrape. Twelve hours later, on the next driver's pre-shift, it would be flagged. Nobody could prove when it happened. The DSP swallowed the cost.
The owner had tried three things before us:
- Paper inspection sheets. Drivers ticked boxes. Half the boxes were always ticked "OK" regardless of vehicle state. Sheets were lost weekly.
- A WhatsApp group with photos. Worked for a month. Photos became unsearchable. Drivers stopped sending them. The owner couldn't prove what was sent when.
- A generic vehicle inspection app. Took 3–4 minutes per check. Drivers skipped it on cold mornings.
What changed in January was structured, mandatory, time-stamped photos at both ends of every shift — and a workflow built so that not taking the photos was harder than taking them.
The protocol they ran
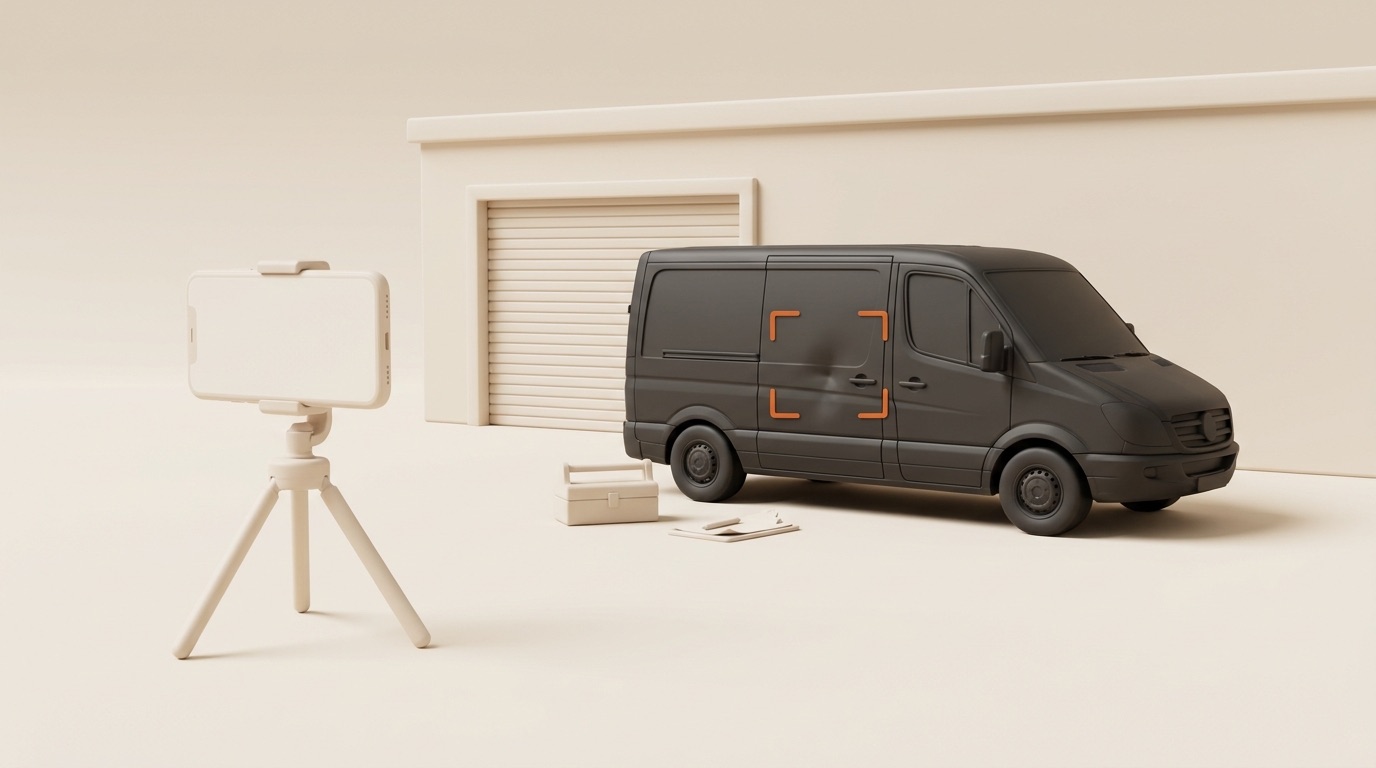
Six photos at shift start. Six photos at shift end. Always the same six angles: front, back, left, right, dashboard, cargo area. Geo-tagged at the depot. Driver can't end the shift without them. Total time on a cold morning, gloves on: under 60 seconds. (We'd argue this is the single biggest design decision in driver-facing fleet software — a pre-shift inspection that takes more than a minute will be skipped, and a skipped inspection is worse than no inspection at all because you've trained the team that the rule is optional.)
Photos auto-uploaded to the dispatcher's review queue. Two days later, before the driver started a new shift, an automatic before/after comparison surfaced any new damage and tagged it.
That's it. No new staff. No new training beyond a 15-minute Saturday morning briefing. Drivers were already taking photos in WhatsApp — this just put structure around it.
The numbers, three months in
The model window: February 1 → April 15, compared against the same 10-week window a year earlier.
| Metric | 2025 window | 2026 window | Change |
|---|---|---|---|
| Total claims filed against the DSP | 22 | 18 | −18% |
| Claims successfully disputed | 5 of 22 | 13 of 18 | +64% win rate |
| Avg. cost per accepted claim | €842 | €580 | −31% |
| Net claim loss in window | €14,310 | €5,170 | −€9,140 |
| Avg. handoff inspection time | 3m 40s | 47s | −78% |
| % of shifts with complete handoff | 62% | 96% | +34 pts |
The line that matters: net claim loss drops by €9,140 in a 10-week window for a fleet of 28 vehicles. Annualized, that's roughly €47,500 — for one modeled operator, one geography, one shift pattern. The size of the effect scales with how much disputed damage you currently eat; the mechanism — time-stamped, geo-tagged handoff evidence through Fleet by Elevera — works the same at any fleet size. Bremen-scale numbers are the high end, not the median.
Why the wins clustered where they did
Walk through the disputed claims in the scenario and look at what tips each dispute the fleet's way. Three patterns:
1. The "wasn't there at handoff" claim. A customer reports damage that the dispatcher's review queue had already flagged from the previous shift's photos — meaning the damage existed before the route in question. Won 11 of 11 of these. Pre-photos, this was unprovable.
2. The "minor scuff over time" claim. Photos across multiple shifts showed a scuff that had been there for two weeks before the customer complained. Insurance adjusters accepted the timeline. Won 4 of 6.
3. The "wrong vehicle" claim. A customer reported a dent matching their description, but the photo log showed that vehicle was never on the route in question. Easy win when the data is structured. Won 2 of 2.
The 5 disputed claims they lost in the window all had one thing in common: an incomplete handoff (driver had ended the shift without taking the cargo or back photo). After the team saw the data, the owner switched the workflow from "warn on incomplete" to "block on incomplete." The April-only dispute win rate jumped to 89%.
What this isn't
A few honest caveats. Photo evidence doesn't prevent damage — it just establishes when and where it happened. The fleet had the same number of real incidents during the window. What changed was the share of those incidents they paid for.
It also doesn't replace driver coaching or vehicle maintenance. The modeled DSP still runs a top-quartile preventive maintenance schedule. Photo evidence is the audit trail; it isn't the operations program. (For the maintenance side, see preventive vs reactive maintenance: a 12-month cost comparison.)
And it doesn't help if the photos take so long that drivers cheat them. We've seen fleets implement 10-photo, 5-minute handoff workflows that produce worse claims data than no protocol at all because compliance collapses. The 60-second target isn't a marketing line — it's a behavioural ceiling.
What we'd recommend if you're starting from scratch
If you're a DSP owner reading this and you don't have structured handoff photos yet, here's the order we'd run it:
- Decide your six angles. Front, back, two sides, dashboard, cargo. Don't add a seventh; you'll regret it in week two.
- Mandate them at both ends of the shift. Start-only photos solve nothing; you need the bookend.
- Make them blocking, not advisory. A driver shouldn't be able to "complete" a shift in the system without all six photos uploaded.
- Auto-compare day-over-day. Without an auto-diff, your dispatcher will look at photos for two weeks and then stop.
- Time-stamp and geo-tag everything. This is what insurance adjusters care about. It's the difference between "we think" and "we have evidence."
- Keep the time under 60 seconds. Measure it weekly. If it creeps above 90 seconds you have a UX problem.
If you'd rather not build the workflow and the dispute logic yourself, Fleet by Elevera ships with all of the above pre-wired — including the day-over-day photo diff that drives most of the wins in the scenario above. The Claims pack module adds the AI-drafted dispute letter for exactly these conversations with insurers.
Related reading on the Fleet journal:
Lena Hoffmann
Customer Success, Elevera
Writing about fleet operations, DSP management, and the data behind last-mile delivery. Part of the team building Fleet by Elevera.
// Continue reading
More from the Fleet Journal
The Amazon DSP scorecard, decoded: how fleet operations drive (and destroy) Fantastic+
Your scorecard isn't a driver problem — it's an operations system. The metrics your fleet controls, and the Wednesday routine that moves them.
The shift handoff checklist: a copy-ready template for delivery fleets
Six photos, tires, mileage, equipment, the 60-second rule. Copy it, print it, or run it digitally.
Why regular vehicle inspections quietly save Amazon DSPs thousands
Most DSPs don't go bankrupt from one catastrophic crash. They bleed out €20–€80 at a time on damage nobody photographed. Here's the inspection routine that stops the bleeding.
Run a data-driven fleet from day one.
Join DSP operators who replaced Excel and WhatsApp with Fleet by Elevera. Book a demo to see it live.