The Amazon DSP scorecard, decoded: how fleet operations drive (and destroy) Fantastic+
Your scorecard isn't a driver problem — it's an operations system. The metrics your fleet controls, and the Wednesday routine that moves them.
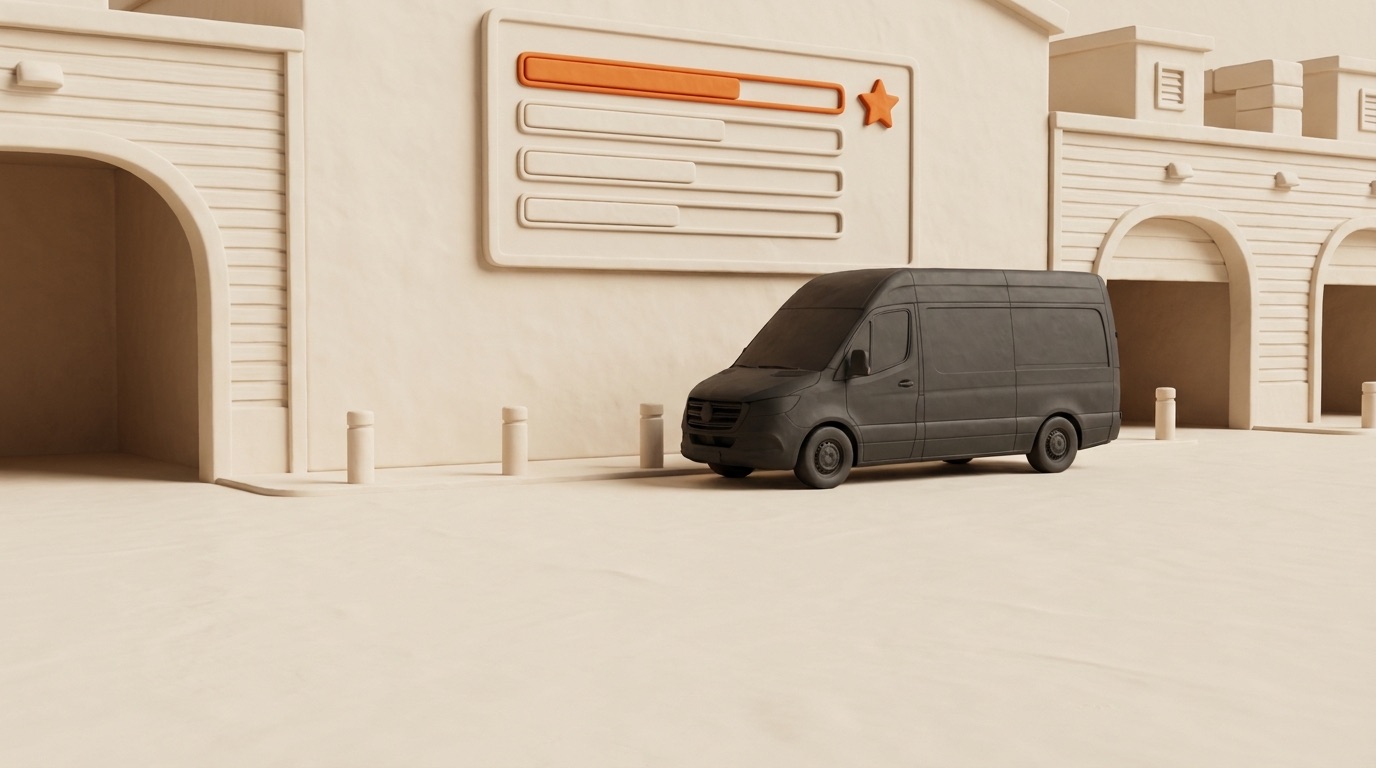
Every Wednesday, thousands of DSP owners open the same document and feel the same thing: a number went red, and nobody knows exactly why. The reflex is almost always the same too — forward the scorecard to the dispatcher with "we need to talk to the drivers."
Here's the argument of this post: most scorecard misses aren't driver problems. They're fleet-operations problems wearing a driver costume. A van that breaks down mid-route shows up as a delivery miss. A skipped inspection shows up as an audit finding. A fleet that strands drivers shows up, three months later, as attrition. The scorecard grades your system, and your system is mostly your fleet.
One thing this post is not: a thresholds reference. Amazon adjusts tiers, weightings, and cut lines regularly, and any blog that promises you the current numbers is already stale. Verify thresholds with your station. The operations layer underneath them doesn't rot — that's what we're covering.
What the scorecard actually grades
The short version, for orientation:
- Tiers. Poor → Fair → Great → Fantastic → Fantastic+, evaluated on a rolling window. The financial difference between tiers is real money — incentive payments that can decide whether a route portfolio is profitable at all.
- Safety and compliance carries the most weight. It's the capping category: you can deliver flawlessly and still be locked out of the top tier by safety events and audit findings.
- Quality and reliability — delivery completion, delivered-not-received rates, photo-on-delivery quality — fills most of the rest.
- Team metrics — including attrition — sit alongside, and they're graded too.
Every one of those categories has a fleet-operations input. That's the part the coaching-centric scorecard guides skip.
The metrics your fleet (not your drivers) controls
Map each scorecard area to what actually produces it operationally:
Breakdowns → completion rate and rescues. A van that dies at 09:30 with 80 stops left doesn't just cost you a tow. Those stops get rescued late or not at all, and the miss lands on your delivery completion. One unreliable van generating two breakdowns a month can single-handedly cap a small fleet's tier. The fix lives in preventive maintenance, not in a driver conversation.
Vehicle audits → inspection records. Review both the vehicle’s actual condition and its inspection history. A structured inspection routine keeps findings and follow-up work traceable. Documentation does not replace resolving a defect.
Incident patterns → operational review. Compare incident descriptions by vehicle, route and time of day. Incidents per 100 shifts adds activity context to the count. Check reporting completeness and operating conditions before interpreting a change.
Attrition → vehicle condition. This is the connection almost nobody makes. Drivers quit fleets that strand them on route, blame them for damage they didn't cause, and make every morning a scramble for keys and scanners. Attrition is a scorecard line and a €4,000–€12,000 replacement bill per departure. Your retention lever is operational fairness, and operational fairness is mostly evidence: photo handoffs mean drivers stop being default suspects.
On-time departure → morning friction. Late pull-outs are rarely lazy drivers. They're missing keys, unassigned vans, dead scanners, and a pre-shift process that takes four minutes when it should take 60 seconds. Fix the morning, fix the metric.
Here's the table to keep next to the scorecard:
| Scorecard symptom | Usual fleet-ops root cause | What to check in your data |
|---|---|---|
| Completion rate dips on specific days | One or two vans with repeat breakdowns | Downtime events per vehicle, last 60 days |
| Safety events trending up | A cluster — driver, van, route, or time block | Incidents per 100 shifts, segmented |
| Vehicle audit findings | No continuous condition record | Inspection completion rate per shift |
| Attrition climbing | Breakdowns + unfair damage blame | Breakdowns per van; disputed damage outcomes |
| Late dispatch | Morning handout chaos | Time from driver arrival to pull-out |
A worked example
The following is an illustrative model, not a customer story — the point is the diagnostic sequence.
Take a 35-van DSP stuck at Great for three consecutive evaluation windows. Ownership assumes a driver-quality problem and budgets for coaching. Before spending it, they decompose the misses week by week.
The finding: three of the five bad weeks trace to exactly two vans — both with repeat engine issues that produced four mid-route breakdowns — plus one route whose incident rate ran at 2.5× the fleet baseline. The other 33 vans and the rest of the routes were performing at Fantastic level the whole time.
| Metric (per 100 shifts) | Before | After 8 weeks |
|---|---|---|
| Incidents — fleet | 4.6 | 2.9 |
| Incidents — the flagged route | 11.2 | 4.1 |
| Breakdowns / month — two flagged vans | 4 | 0 (post-service) |
| Late pull-outs / week | 9 | 3 |
The interventions: the two vans went into preventive service and got swapped onto lighter routes, and the hot route got a van with better sightlines plus one targeted coaching conversation. No fleet-wide policy, no all-hands. Two vans and one route were the entire problem.
That's the general shape of scorecard recovery: decompose, isolate, fix the specific thing. Fleet-wide responses to localized problems burn goodwill and don't move the number.
The Wednesday routine — two tools, honestly
The scorecard lives in Amazon’s portal. Your operational records live in your fleet system. Fleet by Elevera does not integrate the Amazon scorecard into its dashboard. Review the two sources together and verify the current scorecard definitions with your station.
What works is a 45-minute weekly ritual with both open:
| Time | Action | Owner | Tool |
|---|---|---|---|
| 0–10 min | Read the scorecard top to bottom; list every metric that moved | Owner | Amazon portal |
| 10–25 min | For each mover, find the operational trace — incidents, downtime, inspection gaps | Owner + dispatcher | Fleet dashboards |
| 25–35 min | Assign one action per finding: service booking, route review, coaching slot | Dispatcher | Fleet incident queue |
| 35–45 min | Log station-side issues (late dock, missorts) to dispute, not absorb | Dispatcher | Notes + portal |
The bridge between the two tools is you, on a schedule. That's not a software gap to be embarrassed about — it's the operating discipline that separates fleets that recover tiers from fleets that ride the elevator down.
What not to do
Review the underlying records. Check the counts, operating conditions and reporting changes described in the incident-rate guide. Investigate meaningful changes and handle serious incidents immediately rather than waiting for a trend.
Don't punish drivers for station-side problems. Late dock starts, missorted packages, and route overloads show up in your numbers but aren't yours. Log them, timestamp them, dispute them. A driver blamed for a station problem is a driver writing a resignation letter.
Don't buy software expecting the scorecard to fix itself. A fleet platform gives you the instrumentation — the incident rates, the inspection records, the downtime history that this whole post runs on. It doesn't attend the Wednesday review for you. The fleets that climb tiers are the ones that run the routine.
Fleet by Elevera keeps inspection records, incident evidence and maintenance work in the fleet workflow. Amazon’s scorecard remains a separate source for your review. Start a 14-day trial for one van — card required, nothing charged for 14 days, cancel any time.
Related reading on the Fleet journal:
- Incidents per 100 shifts: calculation and limits
- A practical vehicle inspection routine for Amazon DSPs
- Preventive vs reactive maintenance: a 12-month cost comparison
See more of our updates in Google Search and AI Overviews.
Add Fleet as a preferred source on GoogleCo-founder, Product · Elevera
Nedim co-founded Elevera and leads product for Fleet by Elevera. Based in Bottrop, close to the Amazon DSPs the product is built for, he is the bridge between what operators say in the yard and what ships. He works directly with Aslan Kurierdienste, the 36-van DSP whose drivers, dispatchers, and damage cases shaped every workflow in Fleet.
All articles by this author →// Continue reading
More from the Fleet Journal

Onboarding a new DSP route: the first 30 days, in order
What to track in week one, week two, week four. With templates.

Incidents per 100 shifts: how to calculate and use the rate
A practical way to compare incident frequency across operating periods, with the limits that keep the number useful.
Preventive vs reactive maintenance: a 12-month cost comparison
A worked maintenance cost comparison with explicit assumptions, complete arithmetic and limits on what the totals establish.
Run a data-driven fleet from day one.
Join DSP operators who replaced Excel and WhatsApp with Fleet by Elevera. Book a demo to see it live.