Incidents per 100 shifts: how to calculate and use the rate
A practical way to compare incident frequency across operating periods, with the limits that keep the number useful.
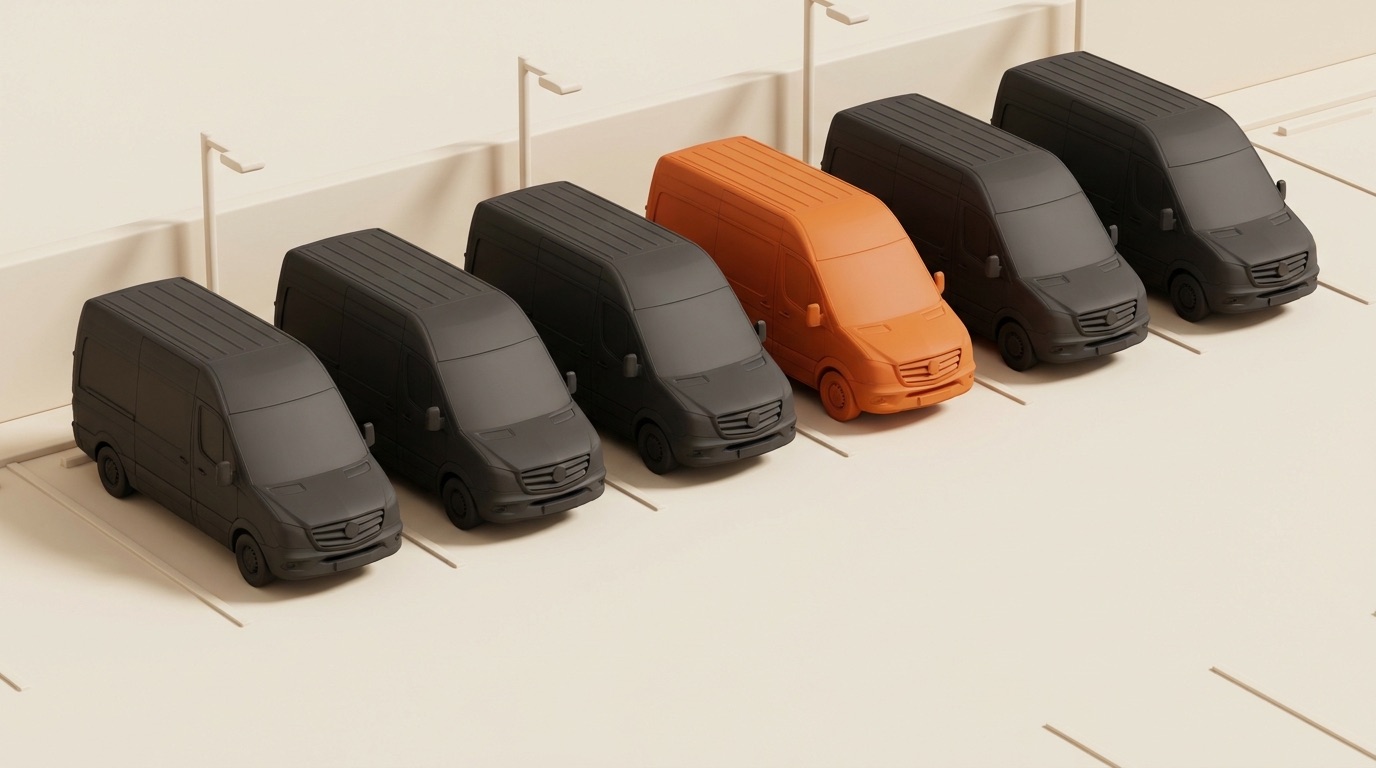
An incident count needs context. A month with more completed shifts gives your fleet more exposure to incidents. A lower count can also reflect less work or fewer reports rather than an improvement in vehicle condition or driving.
Incidents per 100 shifts puts the count alongside one measure of activity. Use it to ask better questions about your operation. It does not adjust for route difficulty, shift length, distance or reporting quality, and it does not replace severity or cost measures.
How to calculate incidents per 100 shifts
Use incident records and completed shifts from the same fleet and time window:
Incidents per 100 shifts =
  (incidents in period / completed shifts in period) × 100
First define what counts as an incident. Keep the definition consistent across the periods you compare. Track a missing inspection photo separately from a collision unless you deliberately maintain a broader category with a clear label. Avoid counting duplicate reports of the same event as separate incidents.
Illustrative calculation: 54 incidents over 1,800 completed shifts gives 3.0 incidents per 100 shifts. A second fleet with 36 incidents over 1,200 completed shifts also has a rate of 3.0. The rates are equal; that alone does not establish equal safety performance.
If there are no completed shifts in the window, the rate is undefined. Show the underlying counts beside every rate so a reader can distinguish a small sample from a sustained pattern.
What normalization does and does not solve
Normalization makes a change in operating volume visible. It does not remove every difference between two periods.
- Growth: compare the rate and count together when adding vehicles or routes.
- Route mix: city-centre work and longer rural routes can involve different exposure. Compare like-for-like work where possible.
- Reporting: a clearer reporting process may initially increase logged incidents. Check whether reporting changed before interpreting a rise as worse performance.
- Severity: a minor scrape and a serious collision each add one to the count. Review their consequences separately.
Your vehicle inspection routine helps establish which vehicle and shift a report relates to. It does not prove responsibility on its own.
Establish your own baseline
Choose a historical window with enough completed shifts to make comparison useful. For example, you could begin with 90 days of records if they are complete and your operating conditions were reasonably consistent. This is a starting choice, not a universal minimum.
Calculate the weekly rate and retain the incident and shift counts. Record changes in routes, weather, vehicle availability and reporting practice alongside the chart. A median can describe a typical week, but neither the median nor an interquartile range automatically distinguishes random variation from a meaningful change.
There is no industry benchmark established by this article. A low rate does not prove that reporting is complete, and a high rate does not identify a driver or vehicle as the cause.
Turn the review into an action
Agree who reviews changes and what evidence they need. The following is an operator checklist, not a description of automated Fleet alerts:
| Finding | Review step |
|---|---|
| Rate rises while shift volume falls | Inspect both counts and sample size before drawing a conclusion |
| Reports cluster around one vehicle | Check incident descriptions, condition photos and maintenance history |
| Reports cluster on a route or time block | Review workload, route conditions and shift context with the team |
| Fewer incidents are being logged | Check inspection completion and whether the reporting process changed |
| A serious incident occurs | Follow the incident response process immediately; do not wait for a weekly rate review |
For vehicle patterns, open the maintenance records alongside the incident history. A cluster is a reason to investigate, not proof of a cause or a basis for automatic blame.
Review frequency, severity and cost separately
The rate answers how often recorded incidents occur relative to shifts. It does not answer how much they cost, whether a claim was accepted, or how long a vehicle was unavailable.
Keep those questions separate. The photo evidence and claims cost model explains why a filed claim, a dispute decision and a payment are different records. The maintenance cost comparison shows how repairs and rental costs can be reviewed without assuming a saving.
Start with your own records
- Choose the period and write down your incident definition.
- Export incident records and completed shifts for that period.
- Remove duplicate reports and calculate the rate with both counts visible.
- Note changes in operating conditions and reporting.
- Assign an owner to review the underlying records and follow up on findings.
Fleet by Elevera brings incident records and evidence into one workflow. Check the current plans and included modules against what your operation needs.
See more of our updates in Google Search and AI Overviews.
Add Fleet as a preferred source on GoogleCo-founder, Product · Elevera
Nedim co-founded Elevera and leads product for Fleet by Elevera. Based in Bottrop, close to the Amazon DSPs the product is built for, he is the bridge between what operators say in the yard and what ships. He works directly with Aslan Kurierdienste, the 36-van DSP whose drivers, dispatchers, and damage cases shaped every workflow in Fleet.
All articles by this author →// Continue reading
More from the Fleet Journal
Photo evidence at handoff: what the claims cost model shows
A worked claims cost model, its assumptions, and the records an operator needs to assess a photo workflow.
The Amazon DSP scorecard, decoded: how fleet operations drive (and destroy) Fantastic+
Your scorecard isn't a driver problem — it's an operations system. The metrics your fleet controls, and the Wednesday routine that moves them.
Preventive vs reactive maintenance: a 12-month cost comparison
A worked maintenance cost comparison with explicit assumptions, complete arithmetic and limits on what the totals establish.
Run a data-driven fleet from day one.
Join DSP operators who replaced Excel and WhatsApp with Fleet by Elevera. Book a demo to see it live.