Photo evidence at handoff: what the claims cost model shows
A worked claims cost model, its assumptions, and the records an operator needs to assess a photo workflow.
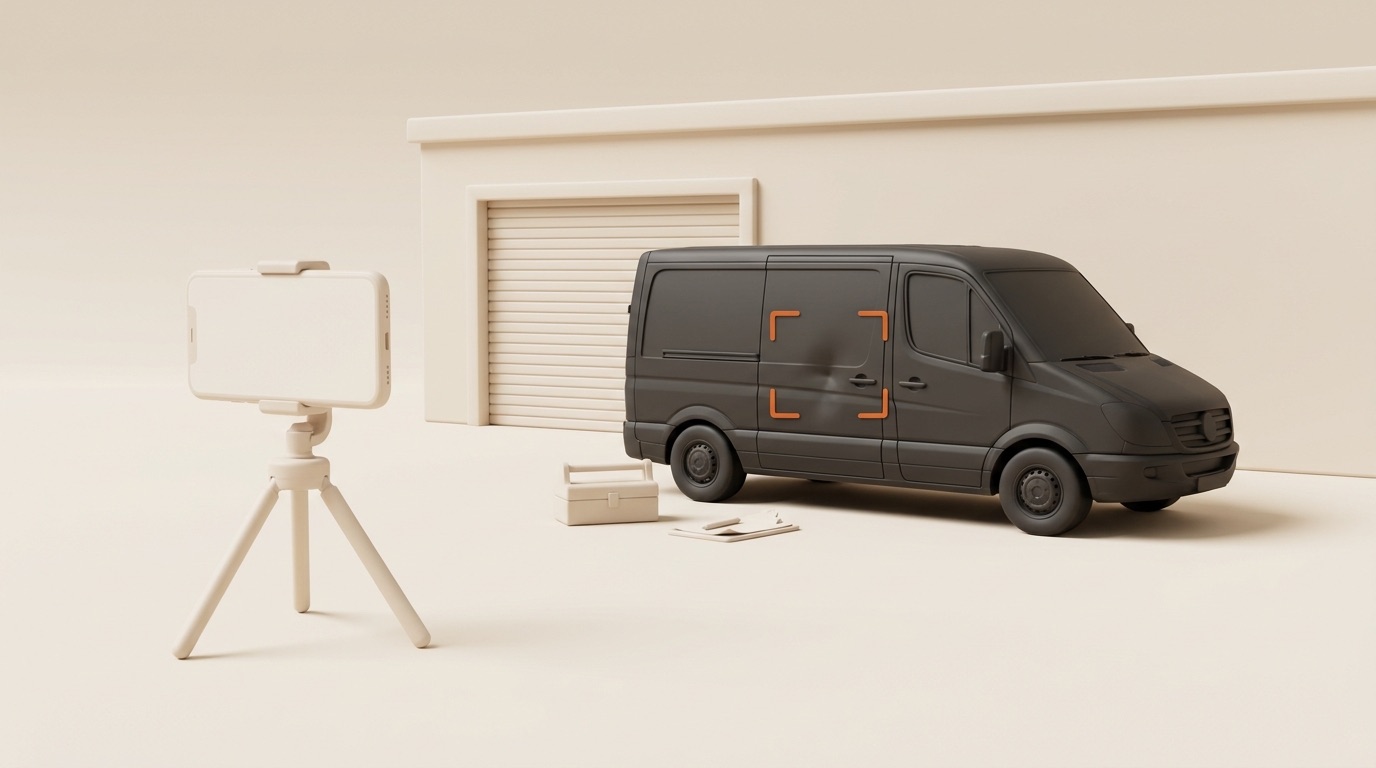
This worked model uses the article’s published inputs for a 28-vehicle fleet: claims filed, claims successfully disputed, and average cost per accepted claim. These are model assumptions, not a measured customer result or a forecast of what Fleet by Elevera will recover.
For the collection step, use the shift handoff checklist to keep the same vehicle views at each handover. Then assign a reviewer to compare the images and resolve unclear changes. The photo review queue guide explains that step in Fleet.
Inputs and recomputed costs
The comparison windows run from February 1 to April 15 in 2025 and 2026. Each contains 74 calendar days when both endpoints are included.
For this calculation, accepted claims are the claims filed minus those successfully disputed. Modeled claim cost equals accepted claims multiplied by their stated average cost.
| Metric | 2025 window | 2026 window | Change |
|---|---|---|---|
| Claims filed | 22 | 18 | −4 |
| Successfully disputed claims | 5 | 13 | +8 |
| Accepted claims | 17 | 5 | −12 |
| Average cost per accepted claim | €842 | €580 | −€262 |
| Modeled claim cost | €14,314 | €2,900 | −€11,414 |
The working is explicit: (22 − 5) × €842 = €14,314; (18 − 13) × €580 = €2,900. The difference is €11,414 within the modeled window. This calculation does not include administration costs, premiums, deductibles or payments not represented in these inputs.
Counts, rates and percentage points
The share of filed claims successfully disputed is 5 ÷ 22 = 22.7% in the first window and 13 ÷ 18 = 72.2% in the second. That is an increase of 49.5 percentage points, calculated before rounding.
Claims filed fall by 4 ÷ 22 = 18.2%. Average cost per accepted claim falls by €262 ÷ €842 = 31.1%. Modeled claim cost falls by €11,414 ÷ €14,314 = 79.7%. These describe different denominators; none establishes how much a photo workflow would change a real fleet’s outcomes.
What the model can establish
The inputs show how claim counts, dispute outcomes and average accepted-claim cost combine. They do not establish which disputes were won because of photographs, whether damage incidence changed, or what an insurer will accept. No annual saving follows without additional assumptions about future claims and comparable operating periods.
For your own records, separate a claim being filed, a dispute decision, an accepted liability amount and an actual payment. Keep the vehicle, inspection photos and incident reference together so a reviewer can inspect the underlying evidence. A generated claim pack still needs review before it is shared.
You can inspect the Fleet by Elevera incident workflow and check the current plans and included modules. Use your own claim records to assess the financial effect.
For incident frequency, compare incidents per 100 shifts separately from claim costs. To account for repairs and replacement vehicles, use the maintenance cost comparison.
See more of our updates in Google Search and AI Overviews.
Add Fleet as a preferred source on GoogleCo-founder, Product · Elevera
Nedim co-founded Elevera and leads product for Fleet by Elevera. Based in Bottrop, close to the Amazon DSPs the product is built for, he is the bridge between what operators say in the yard and what ships. He works directly with Aslan Kurierdienste, the 36-van DSP whose drivers, dispatchers, and damage cases shaped every workflow in Fleet.
All articles by this author →// Continue reading
More from the Fleet Journal
The shift handoff checklist: a copy-ready template for delivery fleets
Six photos, tires, mileage and equipment, with clear responsibilities at issue and return. Copy it, print it, or use it in your process.
Incidents per 100 shifts: how to calculate and use the rate
A practical way to compare incident frequency across operating periods, with the limits that keep the number useful.
Regular vehicle inspections for Amazon DSPs: build a reliable condition record
What to record at each handover, who reviews it, and how to connect a visible change to the next operational action.
Run a data-driven fleet from day one.
Join DSP operators who replaced Excel and WhatsApp with Fleet by Elevera. Book a demo to see it live.